
After publishing a few tools and articles based on safe withdrawal rates, one of the most common questions I’ve seen so far is some iteration of this:
Obviously higher returns support higher withdrawal rates. That’s why I invest in 100% stocks! How can a lower-return portfolio possibly support higher withdrawal rates than a higher-return portfolio?
I admit the answer is fairly unintuitive, and explaining this without getting too deep into the weeds is a bit of a challenge. I’ve touched on it here and there around the site, but this is an important concept that deserves a thorough explanation.
So let’s start by stepping back and looking at the data that usually leads people to the above conclusion.
Start with the Average Return

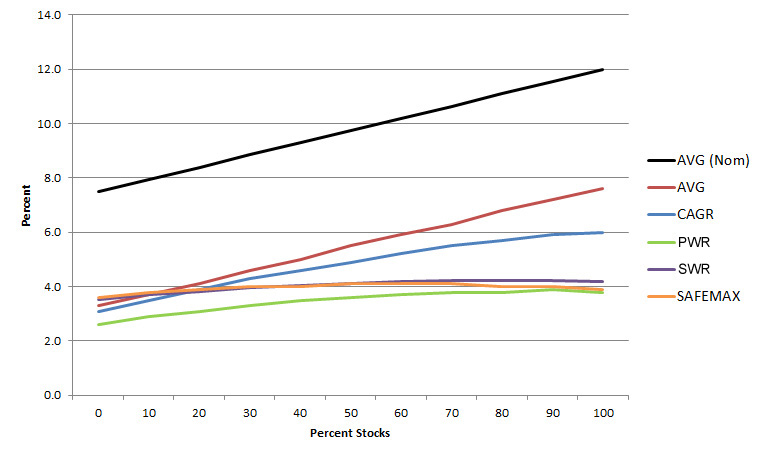
This charts the inflation-adjusted average return since 1972 of a variety of traditional stock/bond portfolios between 0% stocks and 100% stocks. Note that for the purposes of this illustration, “stocks” are the total stock market (VTI) while “bonds” are the total bond market (BND).
One can easily see the linear relationship between higher percentages of stocks and higher returns. No wonder people love stocks! With a 100% stock average return of just about 7.5% real, we can all live on 7.5% a year in retirement, right? Well, it’s more complicated than that.
Volatility Reduces Your Income Over Time

Unfortunately, investors do not receive the average return every year. Markets are volatile, and that underlying volatility has a measurable drag on the returns you actually receive in your investment account relative to what you expect from the average. The blue line tracks the compound annual growth rates (CAGR) that more accurately represent your own portfolio starting in 1972 after accounting for volatility. Note that the difference between the CAGR and the average gets larger with higher percentages of stocks. I’ll spare you the math and just explain that the difference is proportional to the volatility. The greater the volatility the lesser your compound returns, and since stocks are more volatile than bonds you see more of a difference with more stocks.
That’s simple enough. So based on this, surely one can withdraw 6% a year from a heavy stock portfolio and expect it to last forever. Right? Umm… not quite.
Withdrawals are a Drag on Returns

Following an actual retirement scenario, the green line represents the perpetual withdrawal rates that would have maintained the initial principal for a 1972 retiree all the way through 2014. (we’ll get to more timeframes later). Quite the difference!
For those not familiar with retirement withdrawal methodology, the assumption used in most classic retirement studies is that the withdrawal rate is the percentage of the original portfolio the day you retire that you use to pay for annual expenses. After retirement, the withdrawal is completely independent of your portfolio value and every year you adjust the withdrawal to keep up with inflation. Doing it this way maintains constant purchasing power and assumes your standard of living is relatively fixed. While there are a variety of alternative withdrawal methods and I completely agree that a little flexibility in spending during lean years is certainly helpful, I personally think that this method makes great sense for general planning purposes. It’s also by far the most common methodology used in retirement literature.
Note that the high-stock allocations are more affected by the withdrawals than the low-stock allocations. How can that be? Remember, the withdrawals are fixed to inflation (not a percentage of the portfolio every year), and as a result withdrawals are particularly harmful to highly volatile portfolios. Your annual expenses do not care how your portfolio is doing, and when a volatile portfolio drops 50%, the withdrawal as a percentage of the portfolio doubles! Just a few years like that can really have a noticeable effect on withdrawal rates — so much so, that for the first time one can note that 100% stocks is no longer the highest performing allocation.
But that’s for the perpetual withdrawal rate, which is pretty darn conservative. What about the more traditional safe withdrawal rate that isn’t afraid to spend down the principal?
Spending Principal Helps Some Portfolios More Than Others

The purple line represents the safe withdrawal rate that would have reduced the portfolio of a 1972 retiree down to exactly zero at the end of 2014. By spending down the initial principal instead of preserving it, the withdrawal rate line gets an expected bump. (Didn’t know that’s how it works? Read this).
Interestingly, however, low-stock (and low-volatility) portfolios get a larger boost than high-stock portfolios from spending down principal. Perhaps it’s the lower returns that most benefit from the large cash reserves. In any case, that initial line keeps getting flatter and flatter, and high stock percentages are clearly not as powerful as they initially looked.
This is all great, but you’re probably thinking by now that looking at only one retirement period starting in 1972 doesn’t really tell the full story. Good point!
The Start Year Matters

Instead of only modeling a single long retirement period starting in 1972, the orange line shows the lowest safe withdrawal rate calculated by looking at every retirement starting between 1972 to the present up to a 40-year duration. (Incidentally, this is the methodology for all of the WR calculators on this site). Low-volatility portfolios are mostly the same as before, but high volatility options start to drop a little. This is a result of poor timing for the unlucky person who retires immediately before a market drop with a highly volatile portfolio.
So where does this leave us? Let’s cut out the middle steps and look at the final safe withdrawal rates versus our initial expectations.
Average Returns vs. Safe Withdrawal Rates

Now that’s quite the departure from where we started! With low stock allocations, the SWR is actually higher than the average return (because you’re spending down principal, and even with money stuffed under the mattress your savings can last you for a while). And counter-intuitively, holding over 75-80% stocks actually has a negative impact on safe withdrawal rates. The additional volatility eventually eclipses the extra returns and suppresses survivability far more than many people expect.
So with the stock percentage making such a small difference in safe withdrawal rates, does asset allocation really even matter in retirement? If the 4% safe withdrawal rate is relatively fixed across most stock/bond allocations and reducing stock exposure is not necessarily safer, why not simply stay with a high percentage of stocks to ride the better returns and call it a day?
For many people, that’s actually a fine option. But what if I told you there’s a different way to approach the problem altogether?
Beyond Stocks and Bonds
As we’ve seen, safe withdrawal rates are highly influenced not only by average returns, but also by the effects of volatility in multiple steps along the way. That said, once you understand how it works it’s extremely important to internalize one more major point:
The assumption that all asset allocations can be mapped on a spectrum between 100% total stock market and 100% total bond market is completely false
Returns and volatility are not determined solely by the percentage of stocks for every portfolio. If you lift your head from the old papers and figures and toss the original stock and bond assumptions to the side, your eyes will be opened to the myriad of other possibilities completely off the chart!

Glance back to the previous chart for a moment and look at the two points marked on the SAFEMAX line. Now look at this last one and note that they represent the same two stock/bond portfolios. The rest of the cloud of data points represents the Safe Withdrawal Rate (SAFEMAX since 1972) vs. real CAGR for every lazy portfolio found on this site. So much for the assumed linear relationship between returns and withdrawal rates!
Because each portfolio has a significantly more diverse asset allocation compared to the simple 2-asset stock/bond blends, both their returns and volatility are unbound by the limits of the more traditional portfolios. As we’ve learned that withdrawal rates depend heavily on both, these portfolios are able to post retirement performances that will surprise even highly educated investors. Their returns can’t be found in the Trinity study, and each needs to be evaluated on its own merits.
Doing this for every asset allocation is admittedly a lot of work, and I suspect that’s why many people tend to fall back on the traditional stock/bond studies even when the results don’t apply to their own portfolios. But don’t worry — the calculators here do all of the work for you. Give them a spin, and you’re already way ahead of the vast majority of retirement researchers.
The high returns and low volatility found in modern asset allocations open up new frontiers in retirement planning that deserve more attention, and modeling the same tired old stock/bond portfolios over and over (often with dire new warnings) may attract lots of press but misses the boat on the true opportunities for smart investors. Rather than taking the bait from the retirement naysayers, turn the conversation on its head. By understanding how safe withdrawal rates work in the first place, a wise investor can shed the old assumptions holding others back and build a robust retirement portfolio for modern times.
UPDATE: A perceptive reader pointed out that I glossed over one of the most important steps — the difference between nominal and real (inflation-adjusted) returns. Great point!
When you look at fund returns, the top-line number is usually the nominal return. But because of the effects of inflation on your purchasing power, the nominal return is actually quite deceptive. I immediately started with the real average return, but when you look at the final SafeWRs compared to the original nominal returns, the difference is even more stark.
No matter how you invest, always consider the effect of inflation!